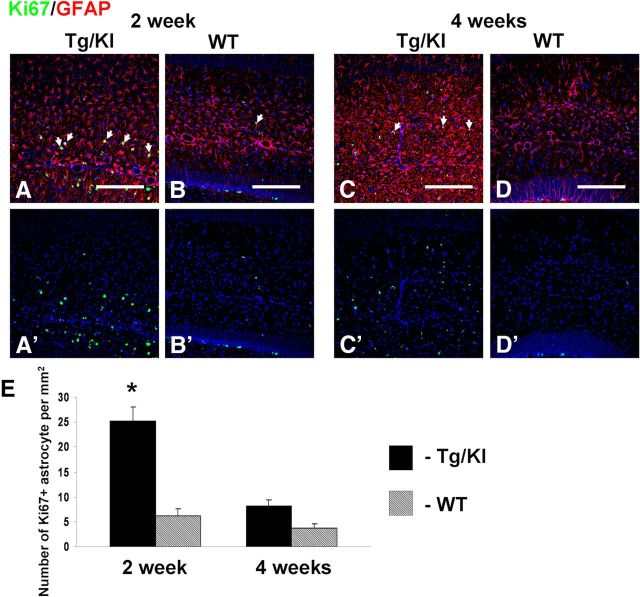
Figure 6.
Astrocyte proliferation in GFAPTg;Gfap+/R236H (Tg/KI) mice at 2 (A) and 4 weeks (C). WT reveals fewer Ki67+ cells at the same ages (B and D, respectively). Ki67+ astrocytes are marked with arrows. Confocal microscopy. A'–D', Split channel for Ki67 of A–D images. Scale bars, 200 μm. E, Graph showing quantitative evaluation of numbers of Ki67+ astrocytes. *Significant difference. Two-way ANOVA, Tukey's test.

