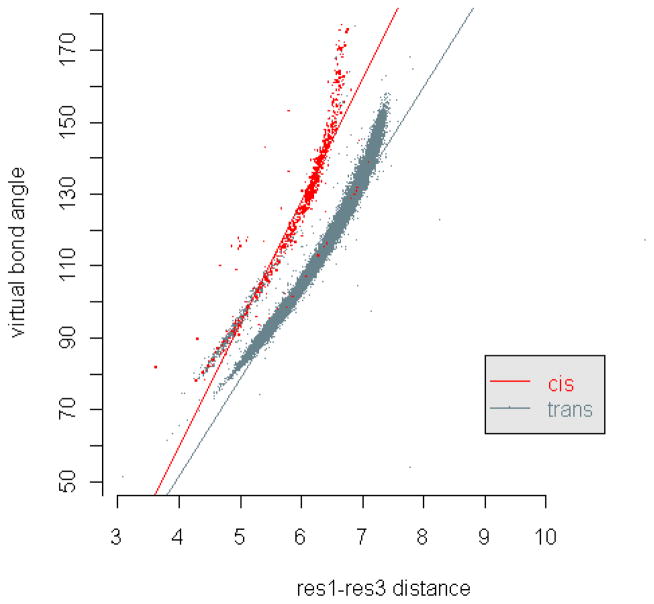
Figure 11. Correlation of residue-level 1–3-distance and virtual bond angle.
The residue-level 1–3-distances and the corresponding virtual bond angles are plotted as dots in a distance-angle plane. The red dots represent the distance-angle pairs with the corresponding residue triplets having a cis structure around one of their virtual bonds.

