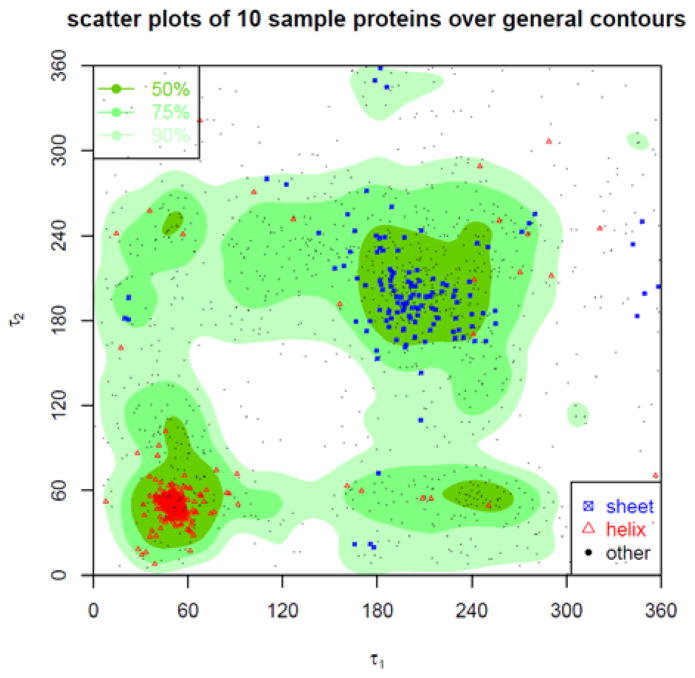
Figure 19. Contour of density distribution of τ1-τ2 angle pairs.
The contour of the density distribution of the τ1-τ2 angle pairs is plotted. The plot is divided into three regions named as most favoured, favoured, and allowed, each containing high 50%, 75%, 90% of all the τ1-τ2 angle pairs. In addition, the τ1-τ2 angle pairs sampled from 10 arbitrarily selected proteins are plotted as dots overlaid on the contour of the general τ1-τ2 density distributions. The red triangles represent the τ1-τ2 angle-pairs in α-helices, the blue squares in β-sheets, and the black dots in other type of secondary structures.

