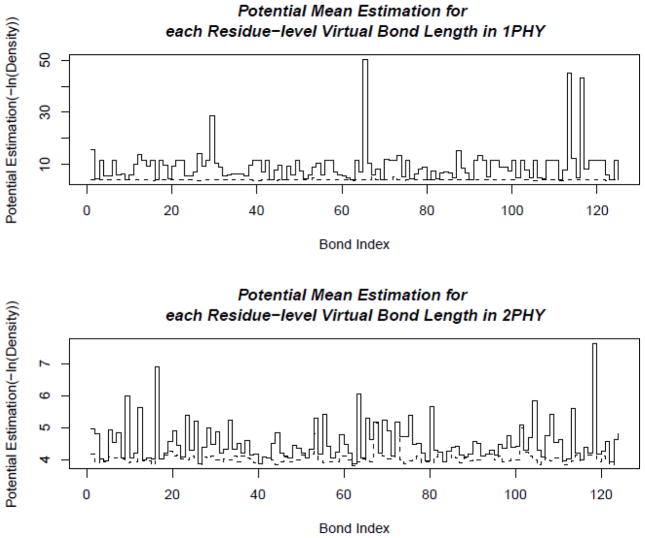
Figure 20. Distributions of virtual bond energies for 1PHY (2.4 Ǻ) and 2PHY (1.4 Ǻ).
The energy levels of the virtual bond lengths of two structures 1PHY and 2PHY are shown in solid lines. The minimal possible energies are plotted as the dashed line. If there is no distribution data for some virtual bond, such as the bond at index 98, the potential function is not defined, and there is a gap in the energy plot for that bond. These two structures are determined with different resolutions for the same protein. The better-resolved structure (2PHY) has lower potential energies in average than the poorly determined one (1PHY).

