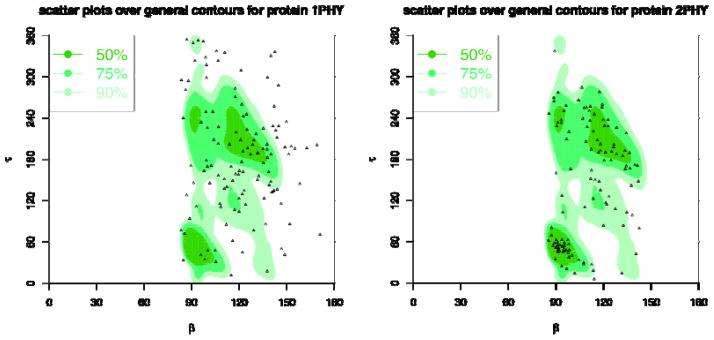
Figure 24. τ-β correlation plots for 1PHY (2.4Ǻ) and 2PHY (1.4Ǻ).

The background plots are the contours of the general density distributions of τ-β angle pairs coloured with different levels of density to indicate high 50% (most favoured), 75% (favoured), and 90% (allowed) regions. The dots correspond to the τ-β angle pairs for the given protein structures. The plot for 1PHY has only 58.54%, 33.33%, and 13.82% angle pairs in allowed, favoured, and most favoured regions, respectively, while 2PHY has 95.9%, 75.41%, and 47.54% angle pairs in those regions.
