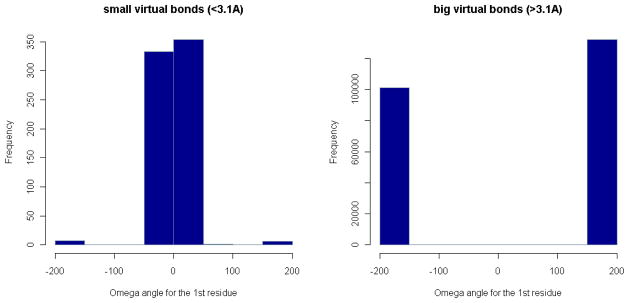
Figure 7. Distributions of ω-angles for residue pairs.

The angle interval [−180°, 180°] is divided into small bins. The number of ω-angles for residue pairs with distance < 3.1Å (or > 3.1Å) in each angle bin is plotted in the whole angle range.

The angle interval [−180°, 180°] is divided into small bins. The number of ω-angles for residue pairs with distance < 3.1Å (or > 3.1Å) in each angle bin is plotted in the whole angle range.