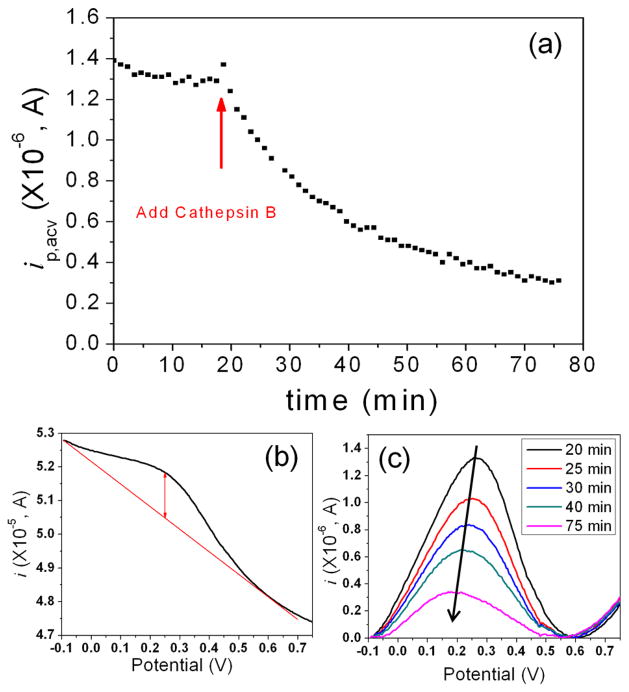
Figure 4.
(a) The change of the peak current (ip,acv) of H2N-(CH2)4-CO-Leu-Arg-Phe-Gly-NH-CH2-Fc immobilized on a VACNF NEA in continuously repeated ACV measurements while 25 μL of 9.8 ng•μL−1 (338 nM) cathepsin B in the activation buffer consisting of 5 mM DTT and 25 mM MES (pH 5.0) was added into the electrochemical cell containing 250 μL of 25 mM MES (pH 5.0). All ACV measurements were carried out at f = 800 Hz and AC voltage amplitude V0 = 150 mV. (b) ACV curve measured at the time of 20 minute immediately after the cathepsin B solution was added into the electrochemical cell. (c) Five representative background-subtracted ACV curves measured at 20 (black), 25 (red), 30 (blue), 40 (green) and 75 minute (pink), respectively, showing the decrease of ip, acv due to enzymatic cleavage

