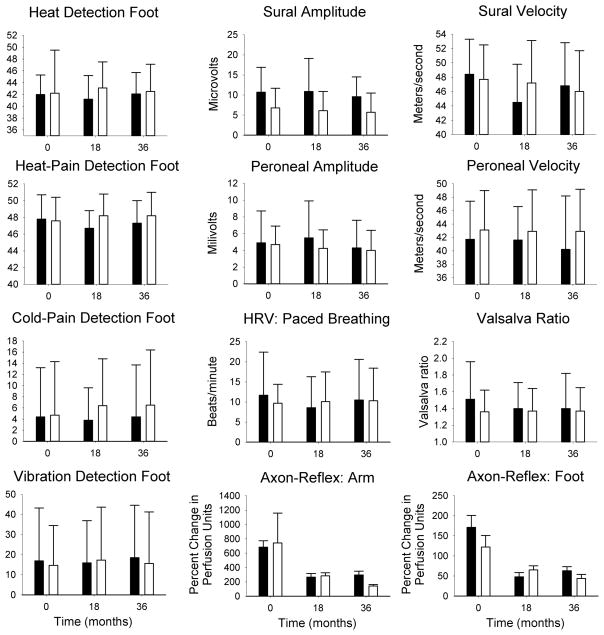
Figure 1. Neurophysiologic test data.
Results for neurophysiologic test data in patients with type 1 diabetes (black bars) and type 2 diabetes (white bars) for baseline, 18 month and 36 month visits. There were no significant differences between individuals with type 1 and type 2 diabetes with the exception of sural amplitude (P<0.05 all visits). Values shown are mean ± standard deviation.

