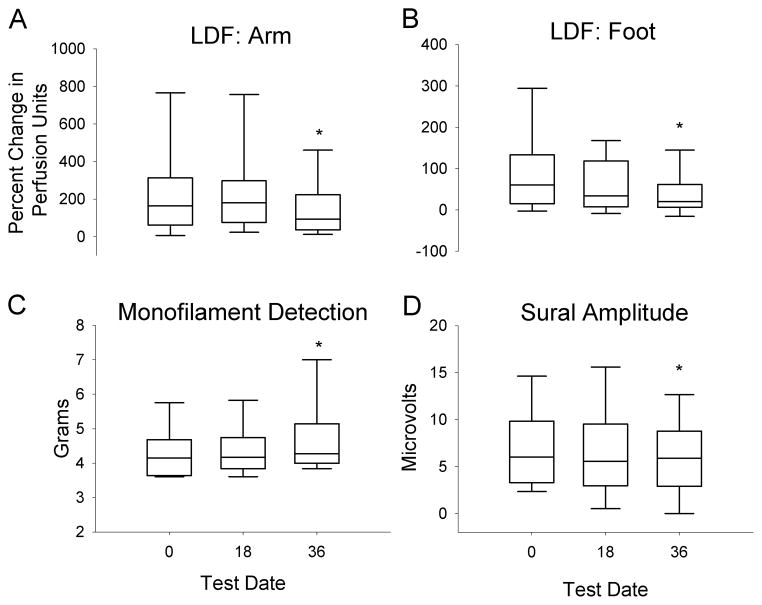
Figure 2. Neurophysiologic outcomes.
Combined results for individuals with type 1 and type 2 diabetes are shown using box plots. There was a significant decrease in laser-Doppler flowmetry (LDF) at the arm (A) and leg (B) by the 36 month visit. There was a significant increase to monofilament detection thresholds (C) and a decrease to sural nerve amplitudes (D) over 36 months. The box plots represent the 25–75% range, with median values denoted by the center line. The 5–95% values are shown with whisker lines. * P<0.05.

