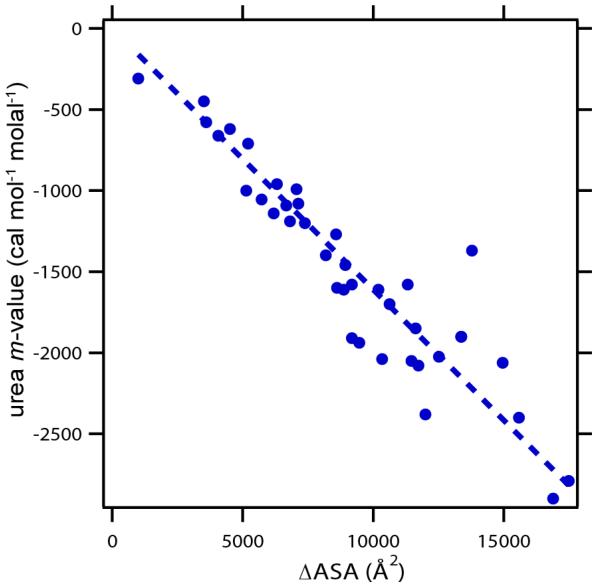
Figure 3.
Myers, Pace, and Scholtz13 Plot of Urea m-values for Protein Unfolding as a Function of ΔASA of Unfolding. Protein data set and ΔASA determinations (for a fully extended model of the urea-denatured state) from Guinn et al8. Unfolding m-values determined at temperatures ranging from 0 to 40°C with most at 20-25°C (for conditions see Hong et al61 and refs therein).

