
Figure 4.
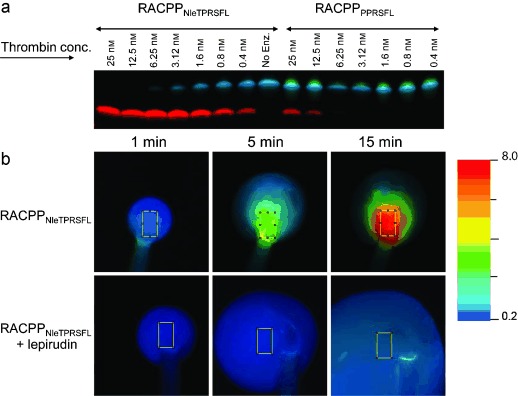
a) Peptide cleavage of RACPPNleTPRSFL and RACPPPPRSFL by purified thrombin at concentrations from 25 nm to 0.4 nm. Peptide cleavage products were separated by electrophoresis and imaged at λex = 620 nm and the emission collected for Cy5 (660 to 720 nm) and Cy7 (760 to 830 nm). Ratiometric images were produced by dividing the Cy5 and Cy7 emission intensities and pseudocoloring. b) Ratiometric fluorescent images showing changes in Cy5/Cy7 emission ratios from tail clots of mice that had been injected with RACPPNleTPRSFL (top) or RACPPNleTPRSFL with lepirudin (bottom). For quantification, average Cy5 and Cy7 fluorescent intensities were acquired from identical ROI (highlighted in figure) and divided to determine the Cy5/Cy7 ratios.