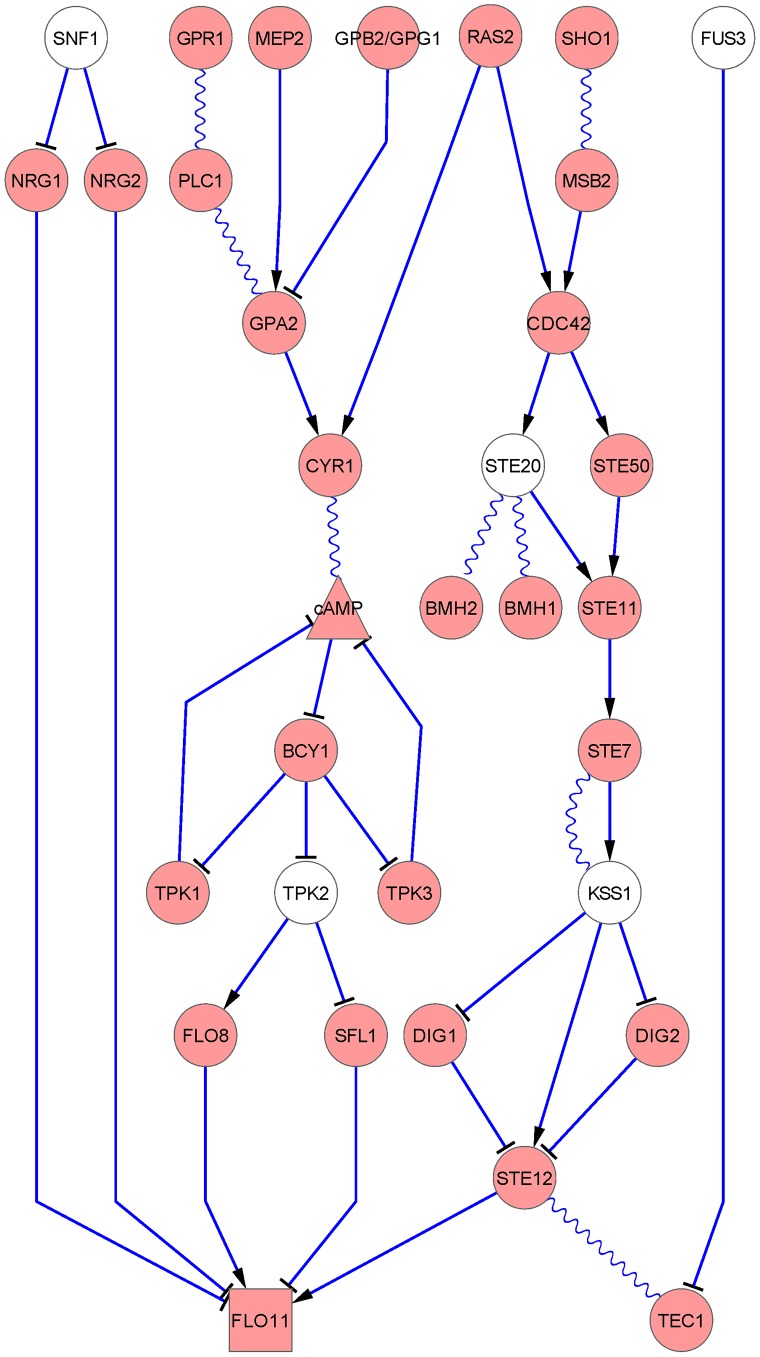
Figure 1. Graphical illustration of the filamentous growth pathway in budding yeast from previous studies.
The ellipses are proteins; the rectangles are genes; and the triangles are metabolites. The linkage between shapes: sharp-end arrows indicate stimulation, T-end arrows indicate inhibition, and wavy lines indicate association. The information were extracted from Science Signaling Database of Cell Signaling [20] and KEGG database [27]. The white ellipses are five of the eight kinases selected to be mutated in our experiments.

