
Figure 3. Correlation heat map of the kinase-dead mutants (log2 ratios adopted).
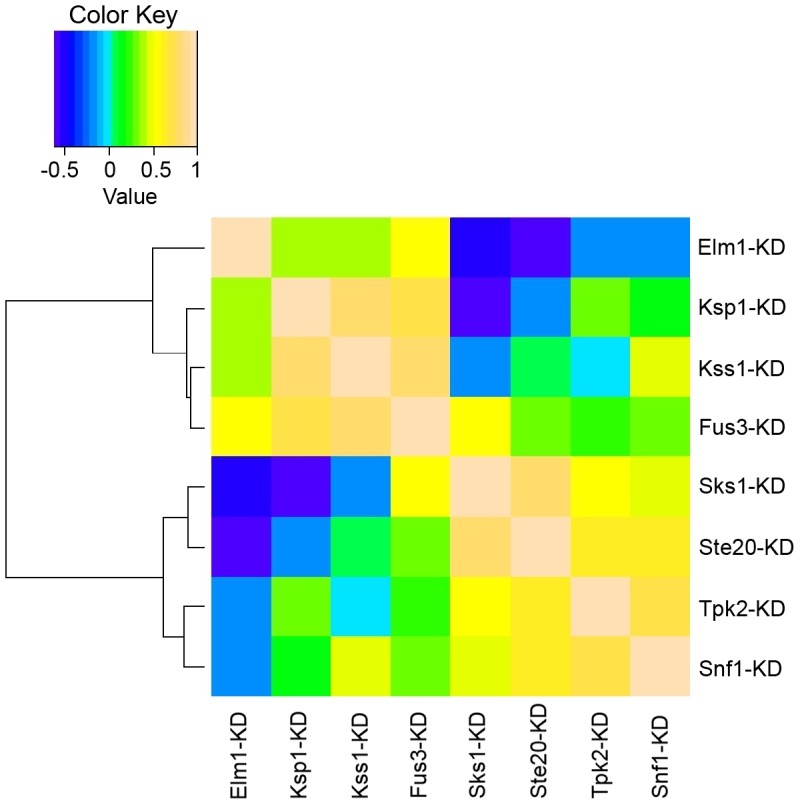
The hierarchical clustering tree using Spearman correlation as the similarity metric is drawn along the left side of the heatmap.
Official websites use .gov
A
.gov website belongs to an official
government organization in the United States.
Secure .gov websites use HTTPS
A lock (
) or https:// means you've safely
connected to the .gov website. Share sensitive
information only on official, secure websites.
The hierarchical clustering tree using Spearman correlation as the similarity metric is drawn along the left side of the heatmap.