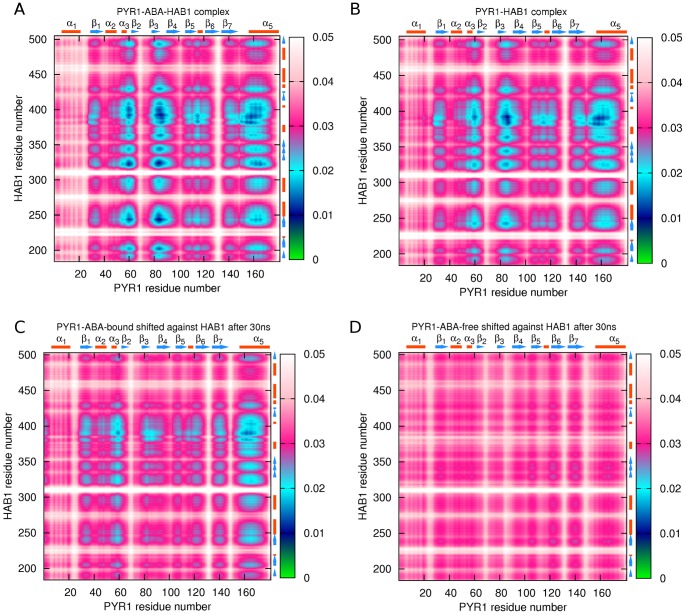
Figure 7.
 atoms correlation maps for PYR1-HAB1 binding areas: (A) – PYR1-ABA-HAB1 complex; (B) – PYR1-HAB1 complex, ABA extracted; (C) – recovered PYR1-ABA-HAB1 complex in which PYR1 was initially shifted against HAB1; (D) – recovered ABA-extracted PYR1-HAB1 complex in which PYR1 was initially shifted against HAB1. In the maps, lower levels of the correlation descriptor represent strong correlations (green and blue regions), and higher levels correspond a relatively uncorrelated motion (white and magenta regions).

