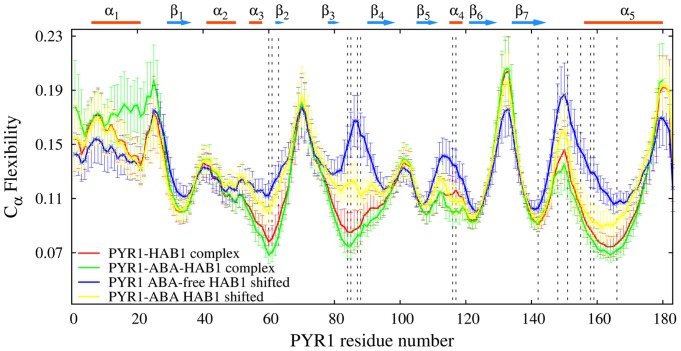
Figure 8. PYR1 main chain flexibility profiles in various complexes with phosphatase: PYR1-ABA-HAB1 complex (green line), ABA-free PYR1-HAB1 complex (red line), partially recovered ABA-bound PYR1-HAB1 complex (yellow line), and partially recovered ABA-free PYR1-HAB1 complex (blue line).
The bars indicate the standard deviations. Dashed lines indicate regions of phosphatase binding.

