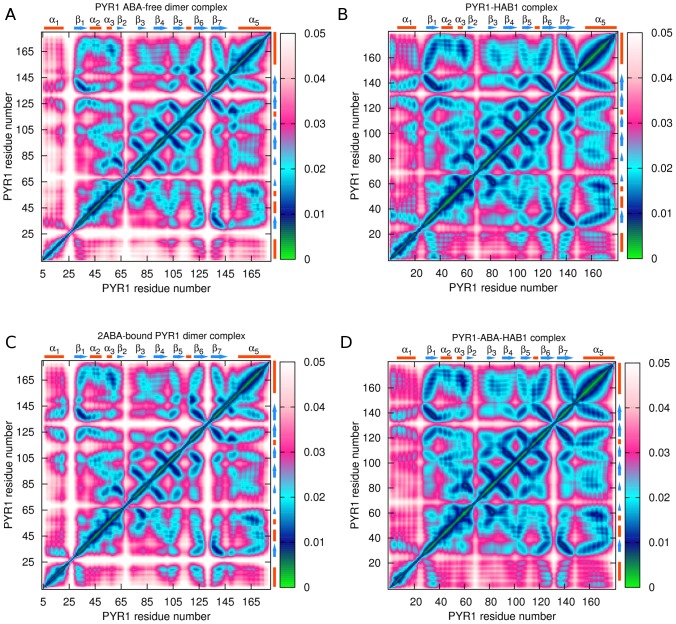
Figure 12. Intra-receptor  atoms correlation maps: (A) – in ligand-free PYR1 dimer; (B) – in PYR1-HAB1 complex; (C) – in 2ABA-bound PYR1 dimer; (D) – in PYR1-ABA-HAB1 complex.
Strong correlations are represented by low values of the descriptor (green and blue colors), whereas high values indicate a more independent motion (magenta and white colors).

