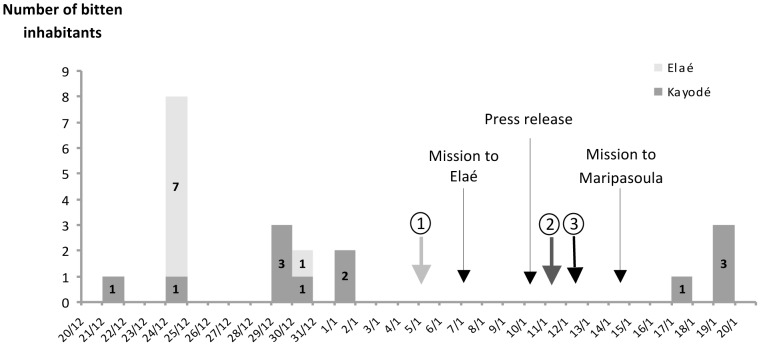
Figure 2. Epidemic curve.
Outbreak clusterings of bat-bitten inhabitants in Elaé and Kayodé in December 2010 and January 2011.  First notification to CART of bat bites
  Second notification.
  Elaé and Kayodé bat-bitten inhabitants informed of the Centre for Anti-Rabies Treatment physicians' intervention on 14 January at the Centre for Prevention and Care of Maripasoula.

