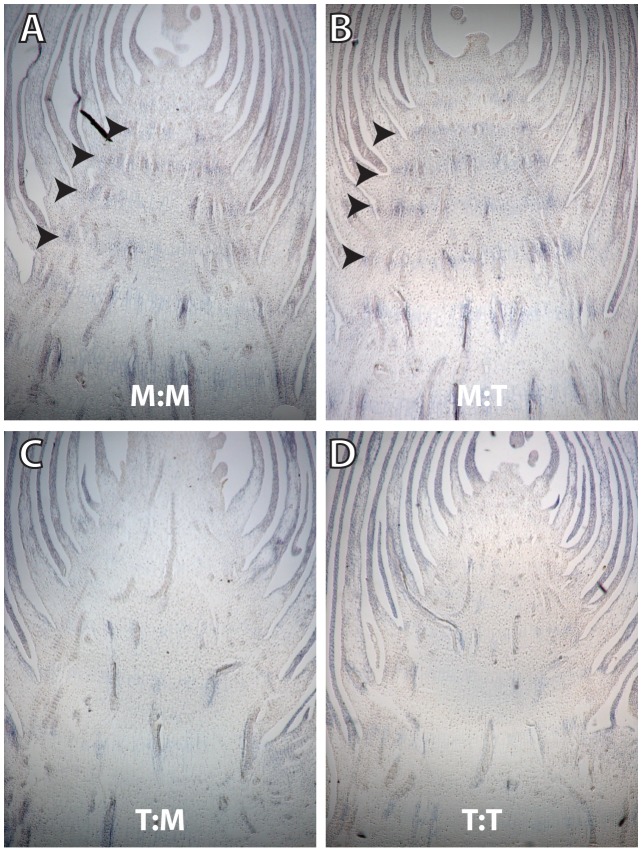
Figure 5. Longitudinal sections of ear-forming primary lateral branches hybridized with antisense gt1 RNA probe.
(A) M:M and (B) M:T genotypes, showing gt1 expressed at low levels in the nodes. (C) T:M and (D) T:T genotypes in which there is no viable gt1 expression in the nodes. Weak gt1 expression is seen in the leaves surround the branch in all sections.

