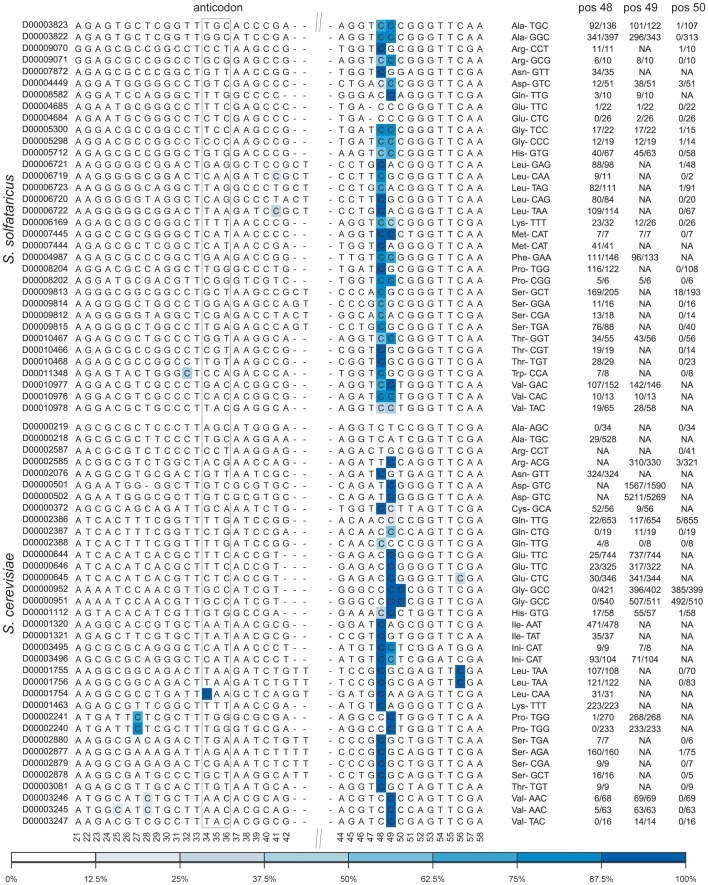
Figure 4. Sites of m5C identified in tRNA molecules of the studied organisms.
Each line denotes a tRNA sequence, identified (left) by its accession number in tRNAdb [41]. Positions along the consensus are indicated below the sequences, numbers based on E. coli tRNA positions as in [31]. The relevant anticodon is given for each tRNA. Methylated positions are color coded by their methylation ratio, according to the presented color gradient (bottom). For positions 48–50, numbers indicate the proportion of reads supporting methylation out of total reads (e.g. 52/56 indicated 52 non-converted reads out of total of 56 covering reads at the specific position). Top-block, tRNAs of S. solfataricus; bottom block, tRNAs of S. cerevisiae.

