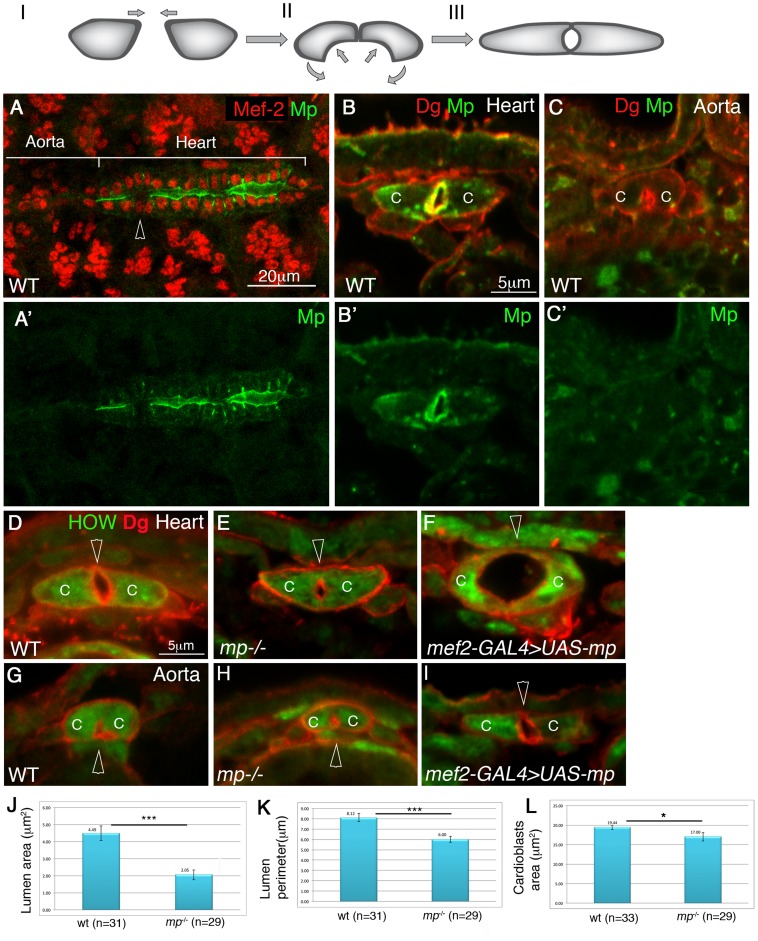
Figure 1. Mp exhibits heart lumen-specific distribution and is necessary and sufficient for cardiac lumen formation.
Upper panel: a scheme of the three stages of cardiac tube closure: I- cardioblasts approach the dorsal midline. II- formation of the dorsal junction and the inward curvature of the luminal membrane. III- formation of the ventral junction and tube closure. Mp initial expression is observed between stage II to stage III (Figure S1). A whole mount wild type embryo at stage 16 labeled for Mp (A,A′, green), and Mef-2 (A, red). The heart and aorta domains are indicated. The arrowhead in A indicates a pair of ostia cells which do not express Mp. B-I are cross sections of stage 16 embryos. Wild type heart (B,B′) or aorta (C,C′) labeled with Dystroglycan (Dg, red, B,C) and Mp (green B,B′,C,C′) demonstrate the cardiac specific distribution of Mp in the heart lumen. D-I are cross sections of: wild type heart (D), mp mutant heart (E), heart cardioblasts overexpressing Mp (F), wild type aorta (G) mp mutant aorta (H), aorta cardioblasts overexpressing Mp (I), labeled with Dg (red) and with anti HOW, which labels the cardioblast cytoplasm (green). Arrowheads in D-I mark the cardiac lumen. Note the formation of large cardiac lumen (29 µm2, F), following Mp overexpression in the heart and the formation of a heart-like lumen in the aorta following Mp overexpression in the aorta. J - quantification of the lumen cross section area, K- quantification of the luminal perimeter, L- quantification of cardioblast cross section area measured from 3–4 cross sections per embryo in multiple number of embryos (n). A statistically significant reduction (indicated by three stars) in both cardiac luminal area (reduction of 55%, p = 8.6E-0.6) and perimeter (reduction of 27%, p = 3.8E-0.50) was observed. A slight reduction in cardioblasts total area was also detected (13%, p = 0.02, one star). C- cardioblast cell. Scale bars represent 20 µm in A,A′, and 5 µm in all cross sections (B,C, D–L).

