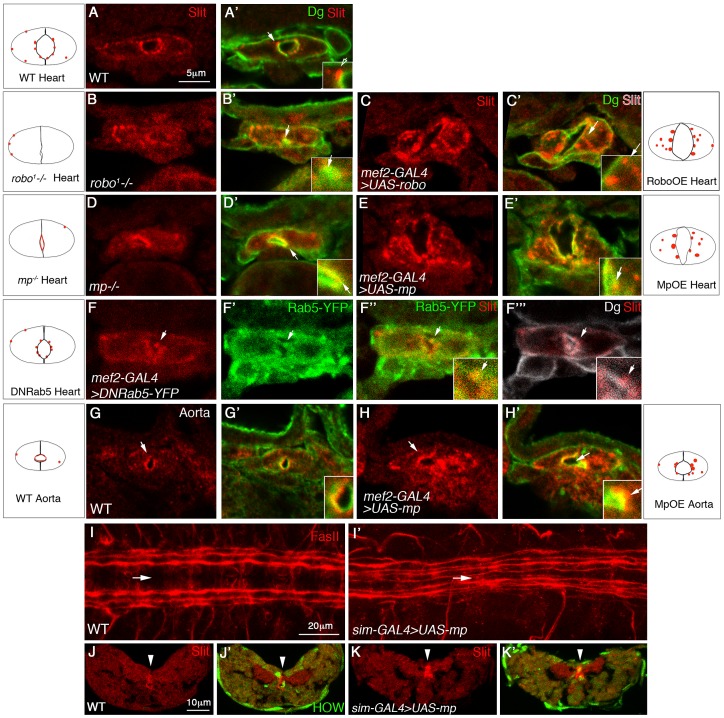
Figure 4. Mp enhances Slit/Robo activity in the heart lumen and modulates Slit distribution in the central nervous system.
Cross sections through the heart (A–F′″) or the aorta (G–H′) of wild type embryos (A, A′, G, G′); robo mutant (B, B′), embryos overexpressing Robo in cardioblasts (C, C′); mp mutant (D, D′), or embryos overexpressing Mp in cardioblasts (E, E′, H, H′) labeled with anti Slit (red) and anti Dg (green). F–F′″ show embryos expressing dominant-negative Rab5-YFP in cardioblasts labeled with Slit (F, red), YFP (F′, green), Slit and YFP (F″), or Slit and Dg (white, F′″). Panels A–H′ are single optical confocal sections to enable comparison of the extent of cytoplasmic Slit vesicles in each genotype. Insets are 2.5 folds enlargement of the heart luminal domain. White arrows in each inset, indicate Slit vesicle/s, with the exception of E′″ where the white arrow indicates Slit vesicle position. Note the reduction in the number and size of Slit endocytic vesicles observed in both mp and robo mutants, and their elevation following Mp and Robo overexpression. Represented schemes of Slit vesicles distribution are indicated for each genotype. Note the alteration in Slit distribution following Rab5 dominant negative overexpression (the majority of the protein overlaps Dg at the luminal membrane, and the cytoplasmic Slit is associated with the luminal membrane). I and I′ show wild type (I), or embryo overexpressing Mp in the midline using sim-GAL4 driver (I′), both labeled for Fasciclin II (red). Note the shortening of the distance between the longitudinal commissures and the midline (marked by the white arrow), following overexpression of Mp. Cross sections through the ventral nerve cord of wild type (J,J′) or an embryo overexpressing Mp in the midline cells (K,K′) labeled with anti Slit (red) and with anti HOW (which marks the midline glia, green J′,K′). High Slit accumulation in the midline (marked by white arrowheads) is observed following overexpression of Mp. Bar in A is 5 µm and represents the magnification in panels A–H′. Bar in I is 20 µm, and represents magnification in I,I′. Bar in J is 10 µm and represents magnification in J–K′).

