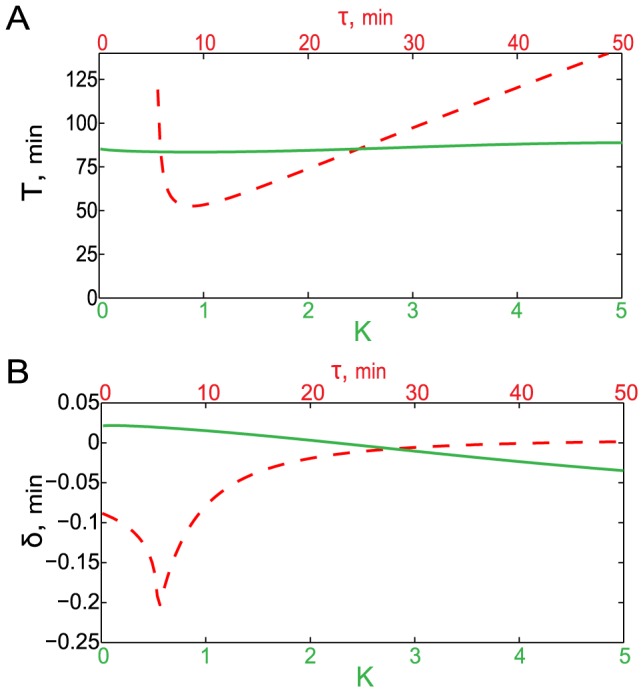
Figure 2. Period and decay rate of oscillations produced by the I B
B -mediated negative feedback system.

(A) The oscillation period  as a function of
  with
with  min (green line) and as a function of
  with
with  (red dashed line). (B) The oscillation decay rate
  as a function of
  with
with  min (green line) and as a function of
  with
with  (red dashed line).
