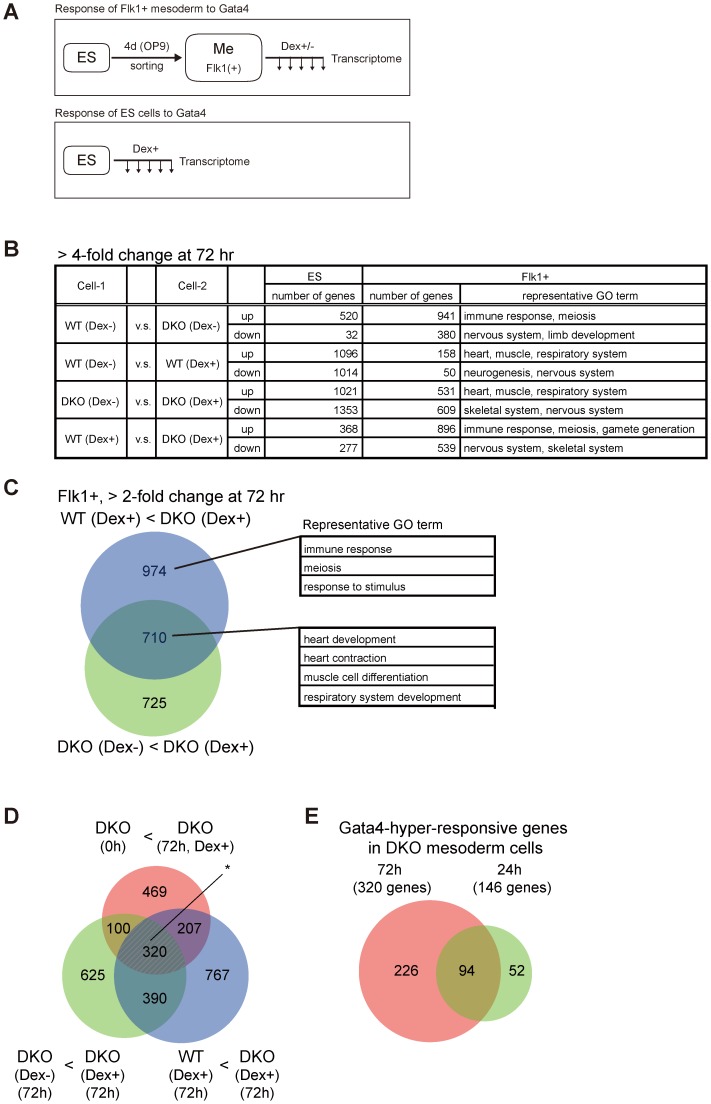
Figure 2. Transcriptome analysis of Gata4-induced DKO Flk1(+) mesoderm cells.
(A) Experimental scheme to examine transcriptome changes in response to Gata4 in mesoderm or ES cells. WT or DKO ES cells stably expressing Gata4GR were differentiated on OP9 stromal cells for 4 days, then the Flk1(+) mesoderm cells (Me) were sorted and cultured with or without Dex to activate Gata4GR (top). The same WT and DKO ES cells were also cultured with Dex in ES culture conditions (bottom). The expression microarray data were obtained at several time points (up to 72 hr) after Gata4GR activation in both mesoderm and ES cells. (B) Numbers of genes with a more than 4-fold difference between the indicated cell conditions 72 hr after Gata4GR activation by the addition of Dex in ES or Flk1(+) mesoderm cells. In each comparison, ‘up’ represents genes expressed higher in Cell-2 than Cell-1, and ‘down’ represents genes expressed lower in Cell-2 than Cell-1. Representative gene ontology (GO) terms at Biological Process level 4 (BP4) for differentially expressed genes in Flk1(+) mesoderm cells are shown in the right column. (C) Venn diagram representing the overlap between (i) the genes expressed 2-fold higher in DKO Flk1(+) mesoderm with Dex at 72 hr than WT cells under the same conditions (WT Dex+<DKO Dex+, purple) and (ii) the genes expressed 2-fold higher in DKO Flk1(+) cells with Dex than the same cells without Dex at 72 hr (DKO Dex−<DKO Dex+, light green). Representative GO terms for genes within the indicated areas are shown. Detailed results of the GO analysis are provided in Tables S1 and S2. (D) Extraction of Gata4-hyper-responsive genes in Dnmt3a/Dnmt3b-deficient Flk1(+) mesoderm cells from transcriptome data. Venn diagrams of the 2-fold upregulated genes in DKO mesoderm with Gata4 activation at 72 hr compared to (i) WT cells under the same conditions (WT Dex+<DKO Dex+, purple), (ii) the same cells without Gata4 activation (DKO Dex−<DKO Dex+, light green), or (iii) the same cells immediately after Flk1(+) sorting (DKO 0 h<DKO Dex+, orange). The overlapping genes of these three categories (320 genes, marked with an asterisk) are considered to be the genes that are upregulated in response to Gata4 preferentially at low DNA methylation levels. (E) Venn diagram of the Gata4-responsive genes in DNA-hypomethylated mesoderm cells at 72 hr and 24 hr identified in (D) and Figure S5. The 94 overlapping genes were used for the analysis in Figure 3, while the 320 genes at 72 hr were used in Figure S6.

