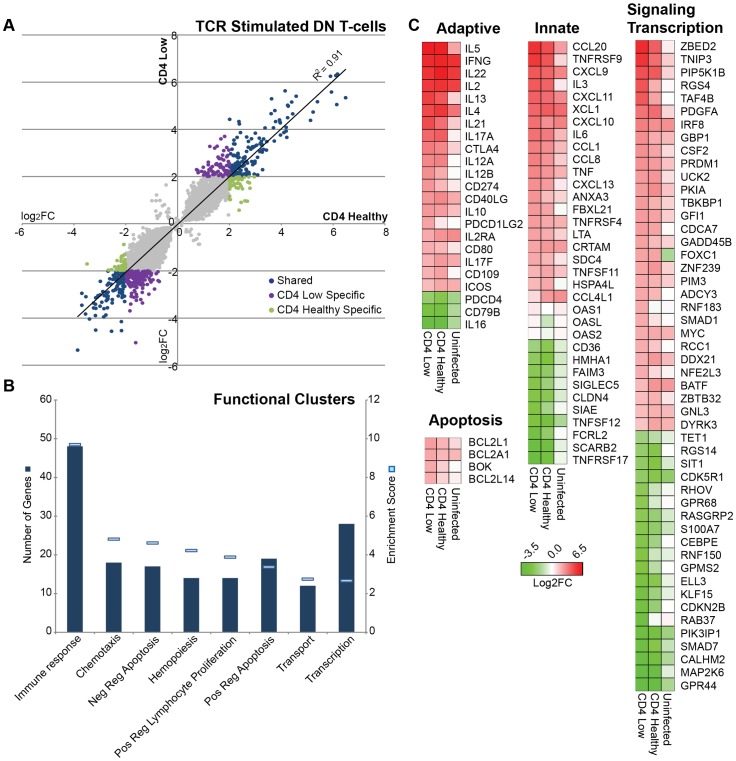
Figure 4. Transcriptome analysis utilizing microarray of TCR stimulated DN T cells from mangabeys depicts upregulation of transcription factors and immunomodulatory genes.
Microarray analysis comparing TCR-stimulated and unstimulated DN T cells. A) DN T cells from two SIV+CD4-healthy and two SIV+CD4-low mangabeys were stimulated with anti-CD3/anti-CD28 and comparative mRNA expression of differentially regulated genes following stimulation of is depicted with less than 4 fold differential regulation depicted in grey, while those with greater than 4 fold differential expression depicted in color (n = 568). In blue are genes regulated to the same extent in DN T cells from both SIV+CD4-low and SIV+CD4-healthy mangabeys, while genes specific to DN T cells from SIV+CD4-low animals are depicted in purple and those specific to DN T cells from SIV+CD4-healthy animals are in green. B) Enrichment data of functional clusters in gene families that are differentially regulated upon stimulation with number of genes shown as columns (dark blue) and extent of enrichment of functional gene clusters (enrichment score) depicted as lines (light blue). Genes involved in immune response and transcription were highly enriched. C) Evaluation of immunomodulatory genes with subsets representing adaptive immunity, innate immunity, apoptosis, signaling and transcription genes are presented as a heat map. Differentially regulated genes from SIV+ CD4-healthy, SIV+ CD4-low and uninfected mangabeys with ≥4 fold differential regulation following TCR stimulation depicting upregulated (red) and downregulated (green) gene expression.

