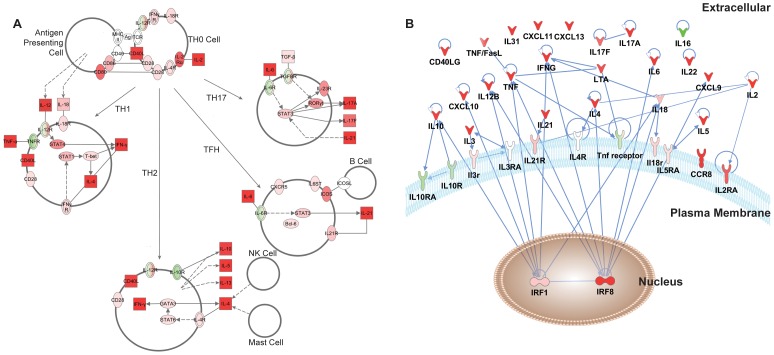
Figure 5. Network interactions of differentially regulated genes in DN T cells.
A) An unsupervised in silico model of genes upregulated in DN T-cells upon TCR stimulation identifies cytokines characteristic of T-helper differentiation (Th1, Th2, TFH and Th17 subtypes) with upregulated (red) and downregulated (green) gene expression depicted. The model also depicts how cytokines expressed by DN T cells may influence immune cells such as antigen presenting cells, B cells, NK cells and mast cells. Squares represent secreted proteins whereas ovals depict receptors or regulatory proteins. B) A network of interactions between the most highly regulated cytokines and their respective regulatory proteins from TCR stimulated DN T cells. Nodes (gene names) represent the upregulated (red) and downregulated (green) cytokines. Edges (blue lines) represent direct interactions between the cognate proteins. The compartmentalization of these proteins into extracellular expression, plasma membrane surface expression and nuclear expression is also depicted.

