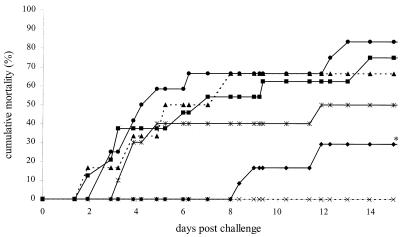
FIG. 2.
Time-mortality relationship of vaccination experiment 1. Cumulative mortality rates of shrimp from the experimental groups vaccinated with VP19 (•), VP28 (⧫), VP19 plus VP28 (*), pET plus pMAL (▪), positive control (▴), and negative control (×) as indicated in Table 1 are plotted against the time after challenge. Lines marked with an asterisk are significantly different from the pET plus pMAL and positive control groups.

