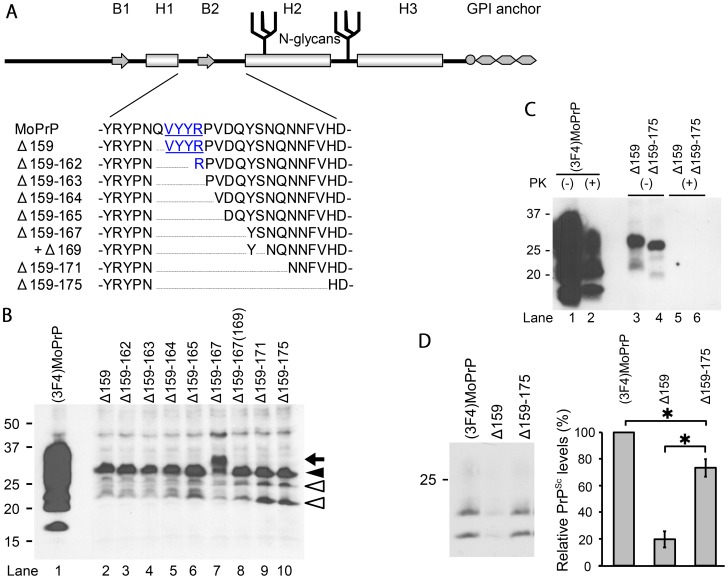
Figure 1. Expression of ΔPrPs and dominant-negative inhibition (DNI) of Δ159 and Δ159–175 in persistently prion-infected cells.
A. Schematic illustration of prion protein secondary structure elements comprising two β-strands (B1 and B2) and three α-helices (H1–3) and post-translational modifications (two N-linked glycans and glycosylphosphatidylinositol anchor) along with position and extent of deletion of ΔPrPs constructs. Deletions in the H1∼H2 portion have a common N-terminal end (residue 159) and gradually extend into the C-terminal direction. All constructs have a 3F4 epitope tag (methionines at residue 108 and 111). Underlined residues denote B1. B. Comparison of ΔPrP expression levels. Representative immunoblot is shown for detection of (3F4)MoPrP and ΔPrPs in transiently transfected N2a cells using mAb 3F4. ΔPrPs are similar in expression level glycosylation appearance, except for Δ159–167 which has an extra fragment larger than the diglycoform (lane 7, arrow). C. ΔPrPs are not converted into PK-resistant PrP in prion-infected cells. 22L-ScN2a cells were transiently transfected with (3F4)MoPrP, Δ159 or Δ159–175, and cell lysates digested with PK or not. Immunoblot was done using mAb 3F4. D. Pilot study for dominant-negative inhibition (DNI) of Δ159 and Δ159–175. DNI was assessed by co-transfecting 22L-ScN2a cells with (3F4)MoPrP and Δ159 or Δ159–175, respectively, and testing for PK-resistant (3F4)MoPrP. Left panel shows representative immunoblot (mAb 3F4) and right panel the statistical analysis of quantified PK-res levels of a triplicate experiment. Empty pcDNA3.1 plasmid was used as control for co-transfection in lane 1. The error bars indicate standard deviation. *, p<0.05.

