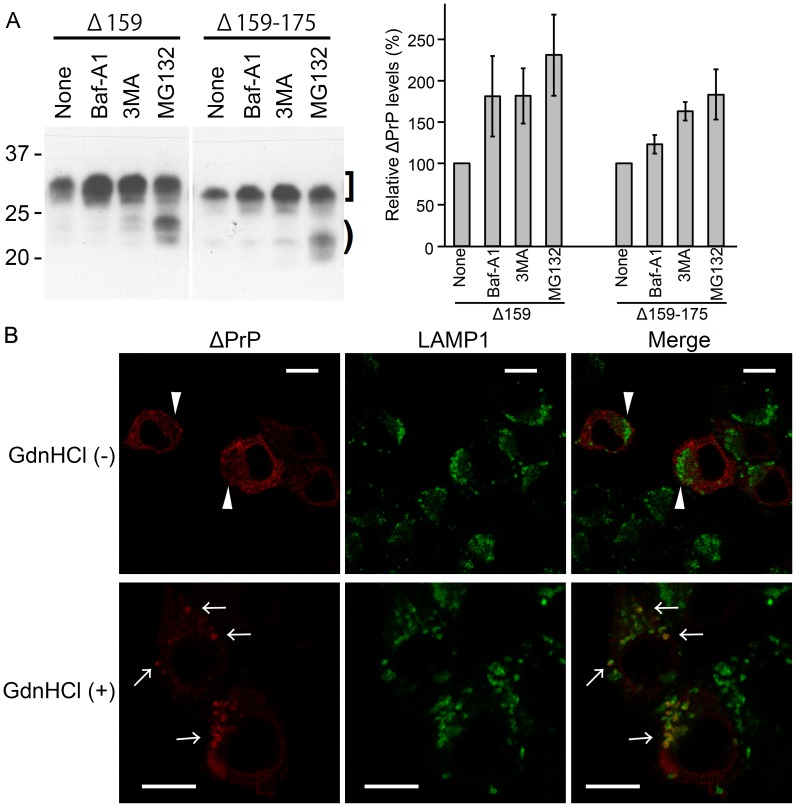
Figure 5. ΔPrPs are degraded by both lysosomal and proteasomal degradation systems.
A. Degradation of ΔPrPs by lysosomal and proteasomal systems. (Left) N2a cells transiently transfected with Δ159 or Δ159–175 were treated for 7 hours with inhibitors either for lysosomal degradation (bafilomycin A1, Baf, 120 nM), autophagy (3-methyladenine, 3MA, 10 mM), or the proteasome (MG132, 10 µM) and cell lysates analyzed in immunoblot for expression of Δ159 and Δ159–175 (mAb 3F4). Square bracket and bracket denote diglycoforms and nonglycoforms of ΔPrPs, respectively. An increment in diglycoforms is observed in Baf- and 3MA-treated cells, whereas in MG132-treated cells also the non-glycoforms are increased. (Right) A graph showing quantification of all PrP bands by densitometric analysis. Data from 3 independent (one in duplicate) experiments for Δ159 and 2 independent (one in duplicate) for Δ159–175 were statistically analyzed for mean and standard deviation (error bars). B. ΔPrPs can be localized in LAMP1-immunopositive vesicles. Immunofluorescence analysis shows distribution of ΔPrP (mAb 3F4) and LAMP1 in cells with or without 6M GdnHCl antigen-retrieval treatment. N2a cells transfected with ΔPrP159 were fixed, permeabilized and incubated without (upper panel) or with 6M GdnHCl (lower panel). With GndHCl treatment ΔPrP is diffusely distributed (arrowheads) and co-localizes poorly with LAMP1. After GdnHCl treatment (lower panel), bright 3F4-immunopositive puncta (arrows) are observed which partly co-localize with LAMP1-positive structures (merge). Scale bars, 10 µm.

