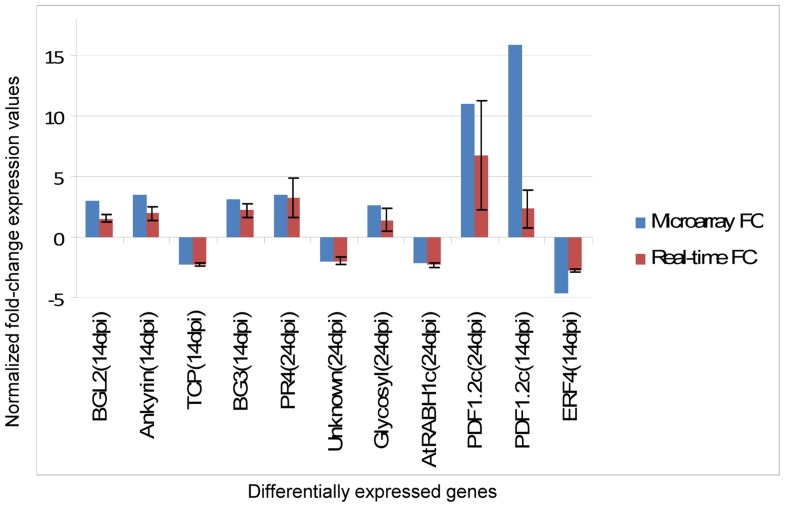
Figure 5. Validation of microarray expression data by relative quantitative real-time RT-PCR (qRT-PCR).
Expression changes of 10 selected transcripts depicting similarities in expression patterns between the two technologies are shown. Signal intensities for each transcript were normalized with CBP20 for 14 dpi and Actin2 for 24 dpi. The x-axis represents validated genes at time points 14 and 24 dpi. The y-axis represents normalized fold-change expression values for each transcript. The error bars show standard deviation from 3 biological replicates.

