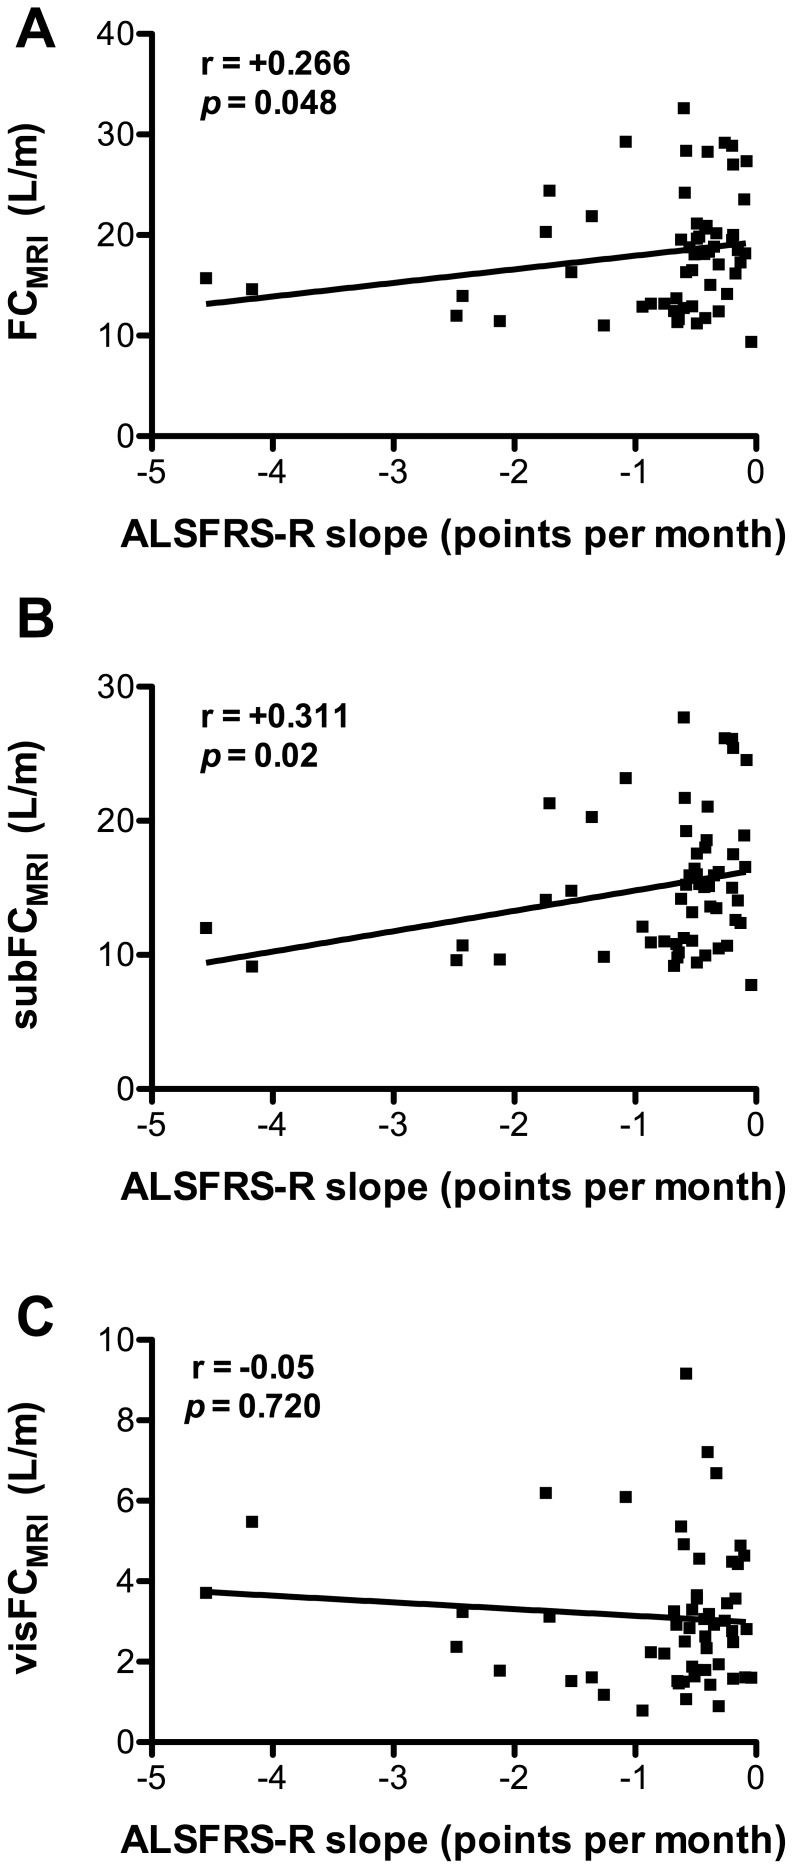
Figure 4. Subcutaneous fat content correlates with disease progression of ALS patients.
Correlations among total (FCMRI, A), subcutaneous (subFCMRI, B), visceral (visFCMRI, C) fat content in MRI scans and slopes of amyotrophic lateral sclerosis functional rating scale scores (ALS-FRS-R, in points per month). p values and the corresponding correlation coefficients (r) are indicated. If the correlation coefficient is positive, the two variables tend to increase or decrease together.

