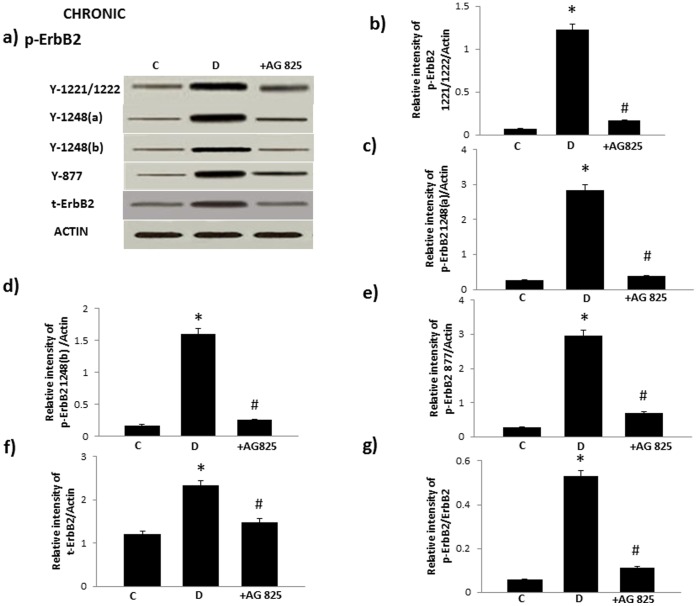
Figure 2. Diabetes–induced phosphorylation of ErbB2 in the mesenteric bed vasculature occurs at multiple tyrosine residues that can be attenuated by chronic treatment AG825.
Panel a) is a representative Western blot showing the levels of phosphorylated ErbB2 (p-ErbB2) at the indicated tyrosines Y1221/1222, Y1248 (detected by separate antibodies labeled as Y1248 a and Y1248b, Y877, total (t-) ErbB2 and β-actin in the isolated mesenteric bed from normal controls (C), diabetic (D) and diabetic animals treated for 4 weeks with AG825 (1 mg/kg/alt-diem; +AG825). Panels b-e) are densitometry histograms showing levels of phosphorylated EGFR at the stated tyrosine residue and panel f) t-ErbB2 normalized to actin whereas panel g) shows the ratio of p-ErbB2 (Y1221/1222) to t-ErbB2. N = 5; Mean±SD. Asterisk (*) indicates significantly different (p<0.05) mean values from normal non-diabetic rats (C) whereas hash (#) indicates significantly different mean values (p<0.05) from diabetic rats (D).

