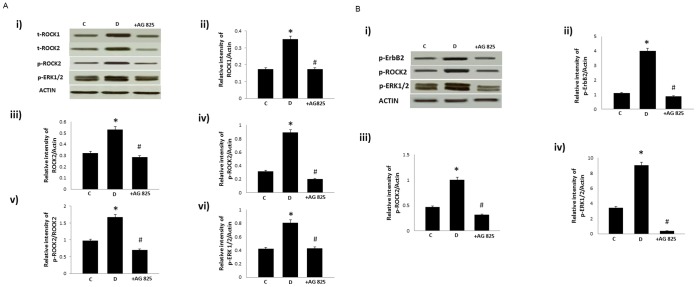
Figure 3. The effect of chronic (A) or acute (B) treatment with AG825 on ROCKs and ERK1/2 signaling in the isolated mesenteric bed of diabetic rats.
A) Panel i) is a representative Western blot showing total (t−) or phosphorylated (p−) levels of the stated proteins in the isolated mesenteric bed from normal controls (C), diabetic (D) and diabetic animals treated either chronically (1 mg/kg/alt-diem) for 4 weeks (shown in figure 3A) or acutely (10−5M) (shown in 3B) with AG825 (+AG825); Panels ii-vi are densitometry histograms showing total (t−) or phosphorylated (p−) levels of the stated proteins normalized to actin. N = 5; Mean±SD. Asterisk (*) indicates significantly different (p<0.05) mean values from normal non-diabetic rats (C) whereas hash (#) indicates significantly different mean values (p<0.05) from diabetic rats (D).

