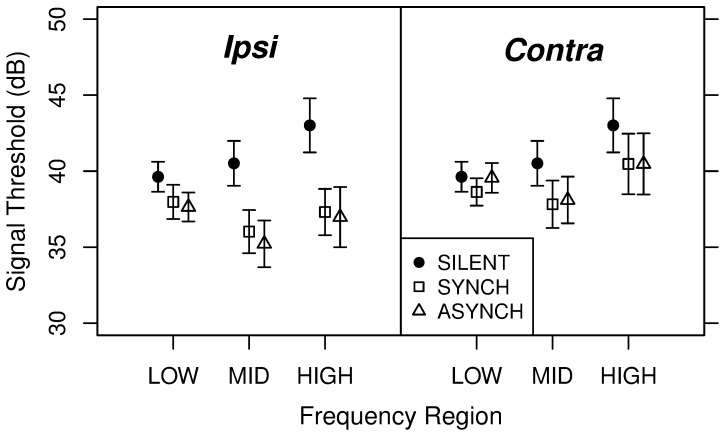
Figure 2. Average target thresholds in experiment 1 (±1 s.e.).
The left and the right panels show respectively the thresholds for detecting the target in the Ipsi and in the Contra conditions, for the SYNCH and ASYNCH precursor type. For the SILENT precursor type, the obtained thresholds are plotted in both panels.

