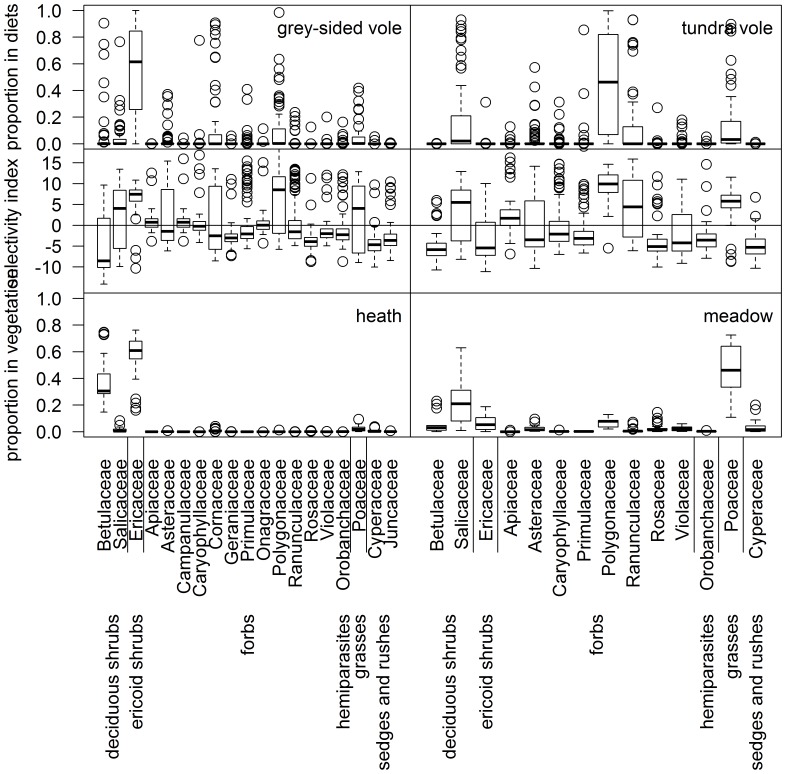
Figure 3. Vole diets, selectivity and food availability based on plant families.
To the left grey-sided voles (Myodes rufocanus, n = 81) and heath vegetation, to the right tundra voles (Microtus oeconomus, n = 66) and meadow vegetation. Upper panels show proportions in diets, middle panels selectivity index and lower panels proportions in vegetation biomass. Selectivity index has been calculated as ratio between diet and vegetation proportions using compositional analysis; see methods for details. Index values above zero indicate preference whereas values below zero avoidance. Black line represents median, boxes first and third quartiles, whiskers either maximum values or 1.5 times interquartile range (whichever is smaller) and points outliers. Plant families are grouped according to functional groups.

