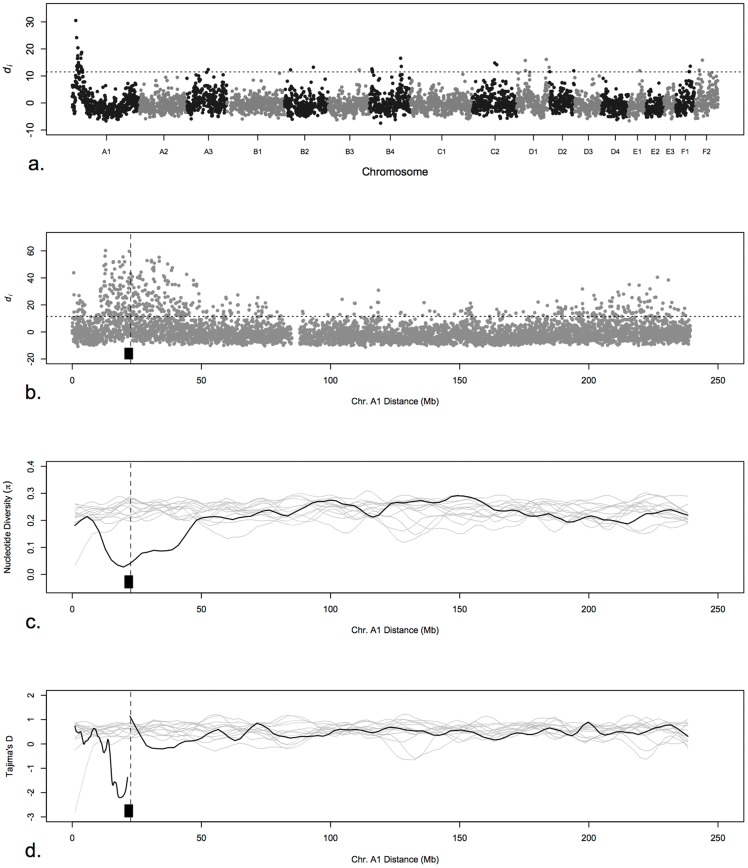
Figure 3. Signatures of selective sweep on chromosome A1 in Cornish Rex breed.
a) Genome-wide di values, displaying significance of chromosome A1 in Cornish Rex tested against all other cat populations. The di value is plotted on the y axis and each autosome is shown in the X axis in alternating colors. Each dot represents one 500 Kb window. The dashed horizontal line represents the 99th percentile of the empirical distribution of di. b) di values for each SNP on chromosome A1. c) A scan of Tajima’s D estimate along chromosome A1. Black line corresponds to Cornish Rex breed and gray lines correspond to other populations. d) A scan of nucleotide diversity along chromosome A1. Black line corresponds to Cornish Rex breed and gray lines correspond to other populations. Black block represents the 3 Mb homozygosity block detected in Cornish Rex and the dashed vertical line represents the mutation location in P2RY5.

