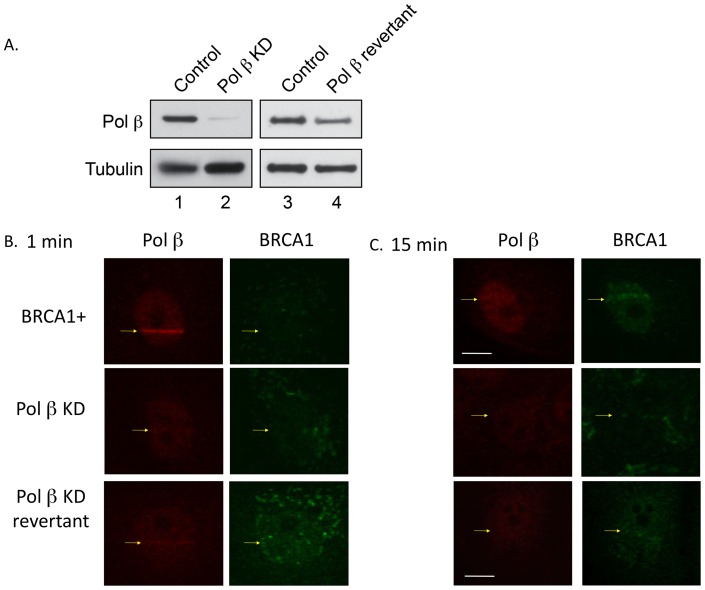
Figure 6. Analysis of pol β KD cells.
A. Western blotting analysis of pol β in a pol β knockdown (KD) cell line and in a partial revertant. B and C. Immunofluorescence imaging of the recruitment of pol β and BRCA1 at 1 and 15 min after irradiation of BRCA1+, pol β KD and pol β KD revertant cell lines. Bars represent 10 µm.

