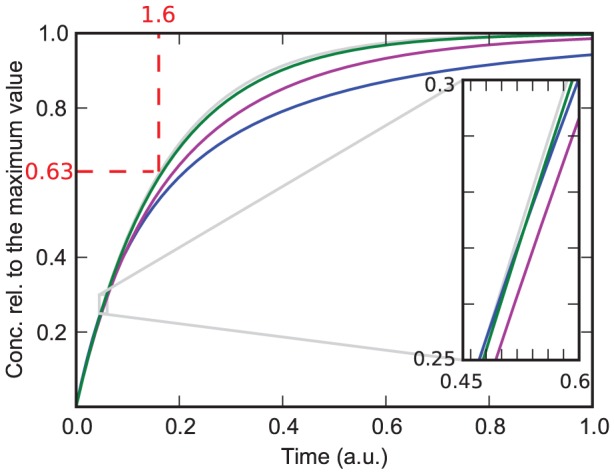
Figure 1. Effect of a variation of  on the one protein one substrate model with dissociation.

Coloured lines: Exact analytical solution (eq. (9)) normalized to  (eq. (13)) with
  ,
,  ,
,  . The value of
  decreases from the lowest (blue) curve (
 ) to the the highest (green) curve (
 = 500). Grey line: QCA solution (eq. (15)) with
  and
and  . The inset shows the section in which the blue curve and the green curve cross, amplified by a factor of
  . The dashed lines illustrate the parameter estimation described in the main text.
