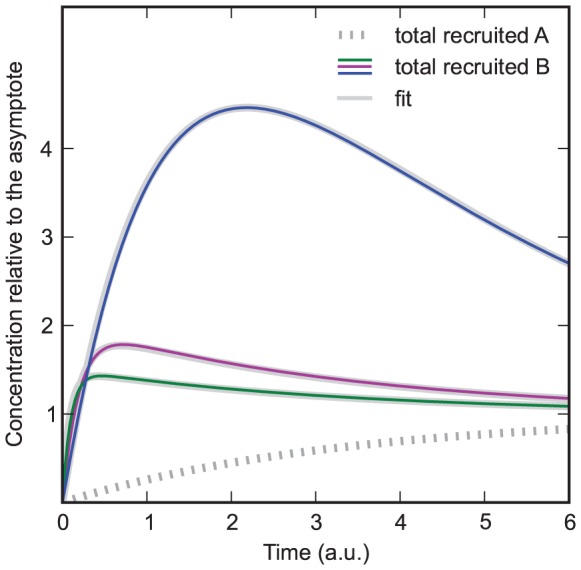
Figure 6. Model in which protein  increases the dissociation rate of
  .
.  ,
,  from green to blue curve,
  and
and  .
.

Grey curves: Fits of the model in which protein  decreases the association rate of
  and in which dissociation is relevant (section B1.3).
