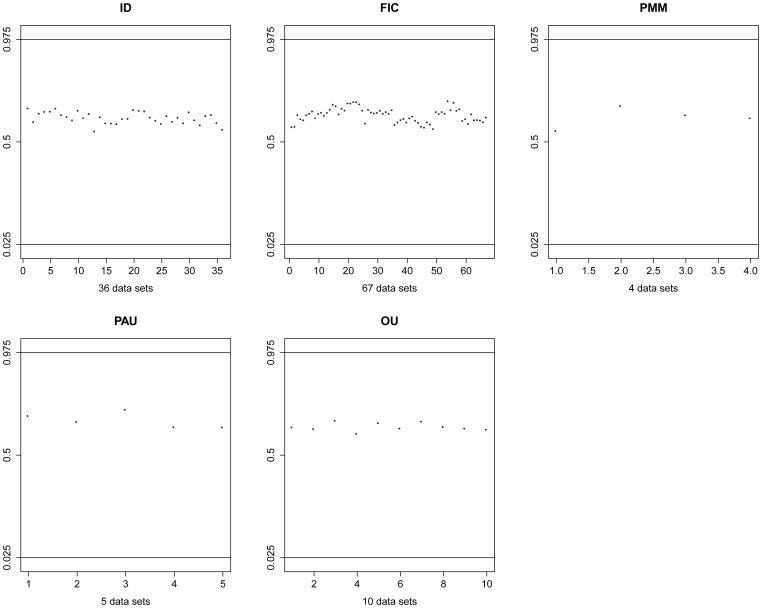
Figure 4. Summary of testing model adequacy.
In each plot the 95 % confidence interval is shown by two horizontal lines (0.025 and 0.975). Each point in the plot represents the rank in the 95 % confidence interval for the empirical data sets. In no cases are the empirical data sets outliers relative to the simulated datasets, suggesting model adequacy.

