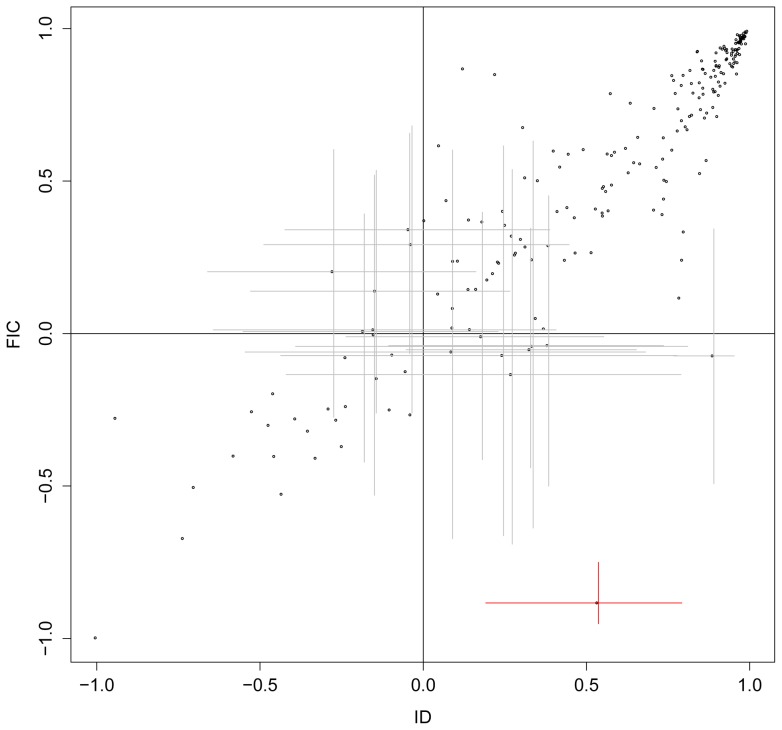
Figure 7. Comparison of correlation between ID and FIC.
On the plots, points in the second and the fourth quadrants are the correlations estimates estimated discordantly (different sign) by ID and FIC. Those points are then shown with the confidence interval. Only such one point, indicated in red, has confidence intervals for both correlations excluding zero, suggesting a difference in sign of the correlation that cannot be due just to uncertainty in the correlation estimates.

