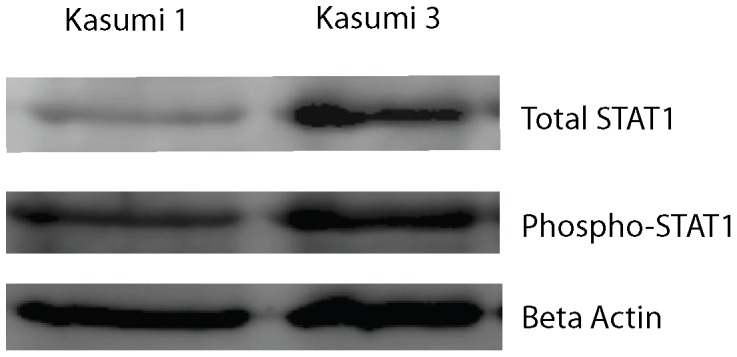
Figure 4. Increased endogenous STAT1 phosphorylation in human Evi1 overexpressed leukemic cell lines.

a) Western blot analysis using anti-total-STAT1 antibody. Lane 1 from left shows total STAT1 protein expression level in Kasumi 1 cells. Lane 2 shows total STAT1 protein level in Kasumi 3 cells. Evi1 overexpressed myeloid leukemic cells demonstrate a higher baseline of STAT1 protein, consistent with our mRNA findings. b) Western blot analysis using anti-phospho-STAT1 antibody. Lane 1 from left shows endogenous phosphorylated STAT1 protein expression level in Kasumi 1 cells (human leukemic cell line without Evi1 expression. Lane 2 shows the STAT1 protein level in Kasumi 3 cells. c) Beta actin loading control.
