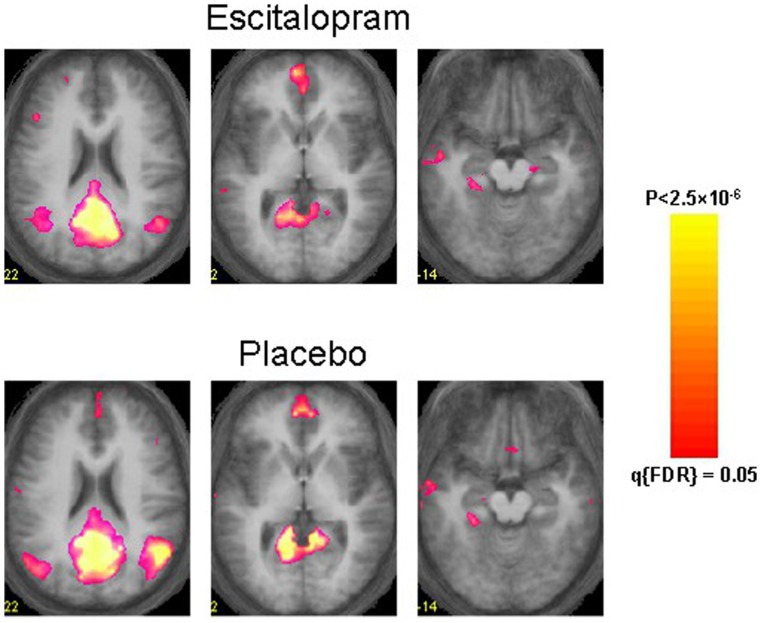
Figure 1. Default-mode networks after escitalopram (upper row) and placebo administration (bottom row).
The figure shows three transverse slices (Talairach-Z coordinates 22, 2 and −14) of ICA-derived functional connectivity maps of the DMN superimposed on the anatomical average of the participants. The left hemisphere is depicted on the left side of each image.

