
Figure 4. Scatterplots.
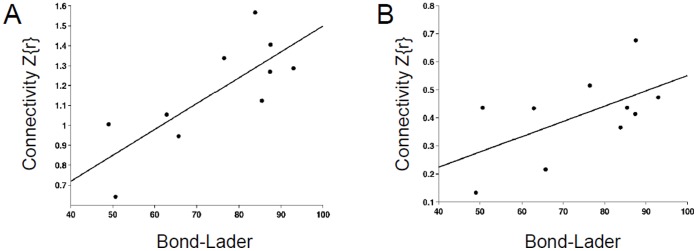
Shown are the scatterplots of functional connectivity between PCC and RIPC (A), and between LIPC and RPHC (B) as a function of alertness ratings of the Bond and Lader VAS scale. Each data point represents one participant. A regression line (least squares fit) is drawn through the data points in each plot. Functional connectivity and VAS rating values are the average of the Escitalopram and Placebo conditions.