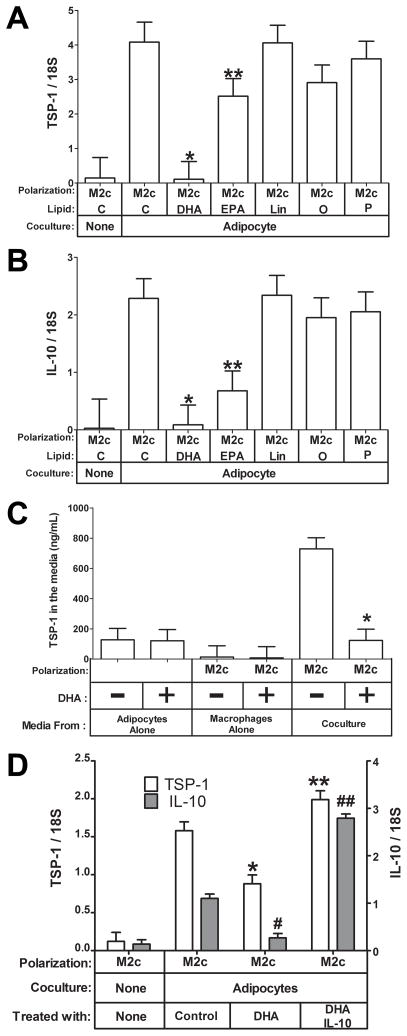
Fig. 6. Effect of Free Fatty Acids on IL-10 and TSP-1 in M2c macrophages cocultured with adipocytes.
M2c macrophages were cultured alone or cocultured with adipocytes in the presence of the indicated free fatty acids (C, Control; DHA, docosahexaenoic acid; EPA, eicosapentanoic acid; Lin, Linoleic acid; O, Oleic acid; P, palmitic acid) at a concentration of 100 μM. Total RNA was prepared and subjected to gene expression analysis by real-time RT PCR. The data are represented as means ± SE (n=3) A) TSP-1 expression. *, **: compare TSP-1 expression in cells treated with the indicated free fatty acid to control treated M2c macrophages (P<0.05). B) *, **: compare IL-10 expression in cells treated with the indicated free fatty acid to control treated M2c macrophages (P<0.05). C)The media from the coculture experiment done in the absence and presence of 100 μM DHA was collected and analyzed for TSP-1 protein expression by ELISA. The data are represented as means ± SE (n=3). *: effect of DHA treatment on TSP-1 in adipocyte-M2c macrophage cocultures (P<0.05). D) The coculture experiment was repeated in the presence of 20 ng/mL IL-10 as indicated; open columns indicate TSP-1 expression; shaded columns indicate IL-10 expression. The data are represented as means ± SE (n=3).*: compare TSP-1 expression to control cells; **: compare TSP-1 expression to DHA-treated cells (P< 0.05). #: compare IL-10 expression to control cells; ##: compare IL-10 expression to DHA-treated cells (P< 0.05).

