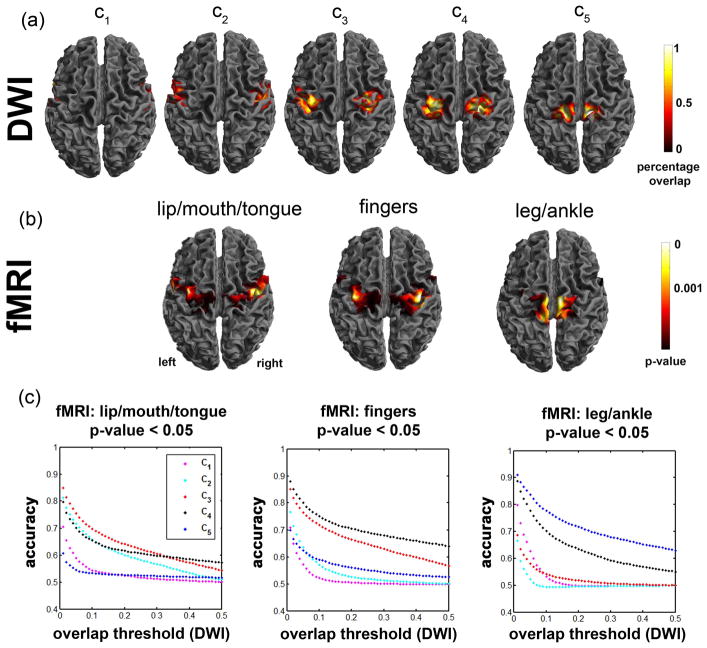
Figure 5.
Comparison of DWI segmentwise clustering localization and fMRI group analysis obtained from 12 normal subjects (test samples). (a) percentage overlap maps of five pathways, ck=1,2,..,5. (b) lip/mouth/tongue, fingers, and leg/ankle areas determined by fMRI. (c). accuracy measures between DWI and fMRI. In order to assess the accuracy of individual DWI segmentwise clusters compared with fMRI maps of “mouth/lip”, “fingers”, and “leg/ankle” at p-value <0.05, receiver operating characteristic curves were plotted at varying overlap thresholds.

