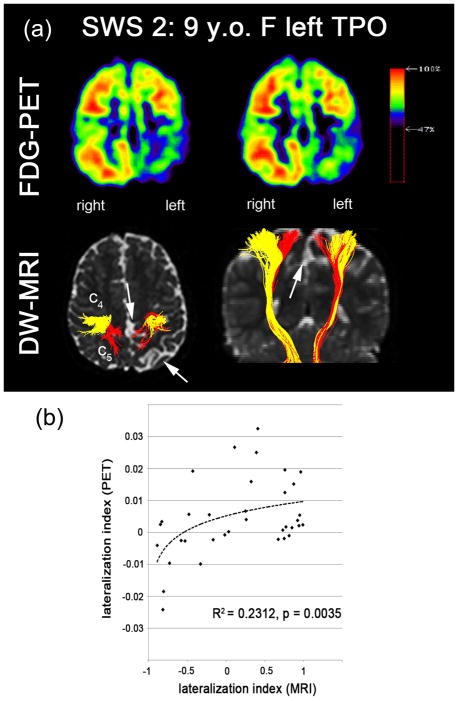
Figure 7.
Correlation between FDG-PET and DW-MRI. (a) spatial correlation of FDG hypometabolism and reduced fiber density assessed in SWS 2: 9 years old female having abnormal lesions in left temporal, parietal, and occipital lobe. Significantly reduced glucose uptake and CST projection were found near c4 and c5 in left hemisphere, marked by white arrows pointing out atrophic cortex and white matter infarct. (b) PET-MRI correlation analysis in seven patients with unilateral SWS. LI values of PET and MRI were evaluated from five clusters, ck=1,2,..,5 of the CST pathways. Significant Pearson’s correlation coefficient (R) was found (R2 = 0.2312, p-value=0.0032). Dashed line indicates a log-fit.

