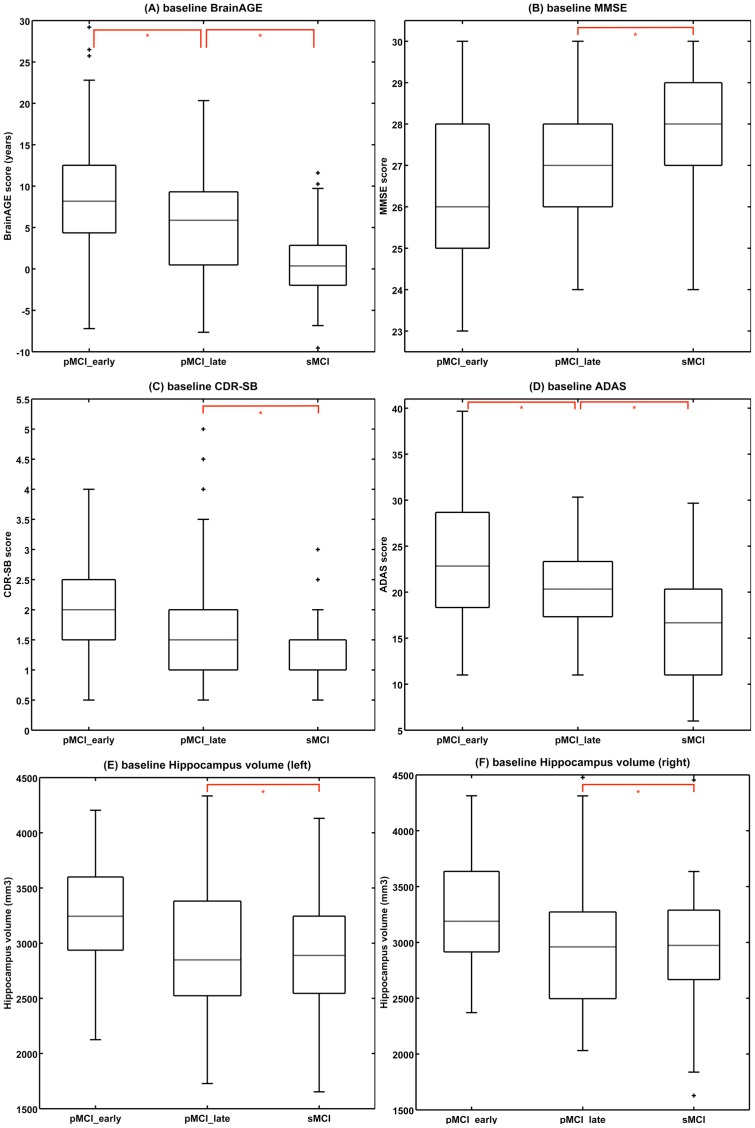
Figure 2. Baseline scores in all MCI groups.
Shown are box plots for baseline (A) BrainAGE scores (in years), (B) MMSE scores, (C) CDR-SB scores, (D) ADAS scores, (E) left and (F) right hippocampus volumes (in mm3) of all diagnostic groups. Post-hoc t-tests resulting in significant differences between diagnostic groups are indicated (p<0.05; red lines). The boxes contain the values between the 25th and 75th percentiles, including the median (dashed line). Lines extending above and below each box symbolize data within 1.5 times the interquartile range (outliers are displayed with a +). Width of the boxes indicates the group size.

