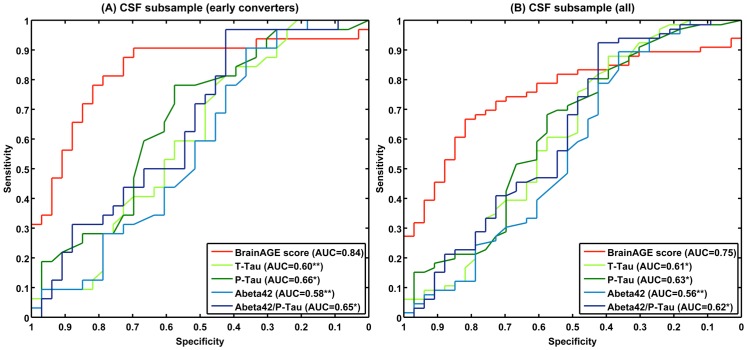
Figure 8. ROC curves of individual subject classification to sMCI or pMCI in the CSF subsample.
ROC curves of individual subject classification to sMCICSF or pMCICSF based on baseline BrainAGE scores and CSF biomarkers for (A) early converters and (B) the whole CSF subsample. The areas under the ROC curves (AUCs) of the CSF biomarkers were tested against the AUC of BrainAGE: **p<0.01; *p<0.05.

