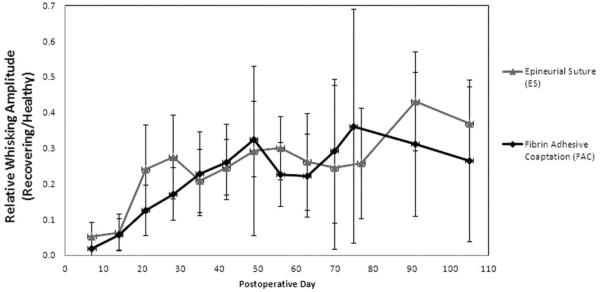
Fig. 2.

Whisking amplitude of epineurial suture (ES) and fibrin adhesive coaptation (FAC) groups plotted as recovering side amplitude divided by healthy side amplitude (i.e., relative recovery) over time. A value of 1 would represent symmetric whisking amplitude. Error bars indicate ±1 standard deviation.
