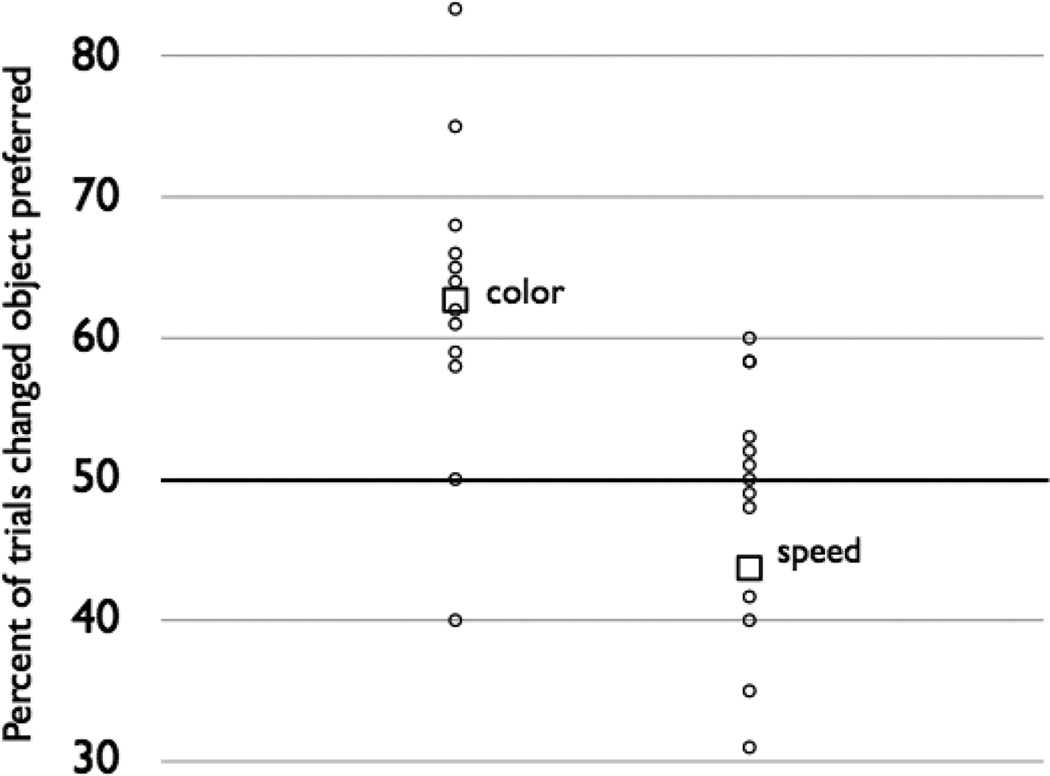
Figure 4.
Results of Experiment 2. The figure shows the percentage of preference for the changed object by individuals (circles) and the group averages (squares) in the color vs. motion (speed) memory tests. Infants significantly preferred the changed object when it changed color, but not when it changed speed.

